Phipps Stories

#bioPGH Blog: Digging Through the Data!
 A resource of Biophilia: Pittsburgh, #bioPGH is a weekly blog and social media series that aims to encourage both children and adults to reconnect with nature and enjoy what each of our distinctive seasons has to offer.
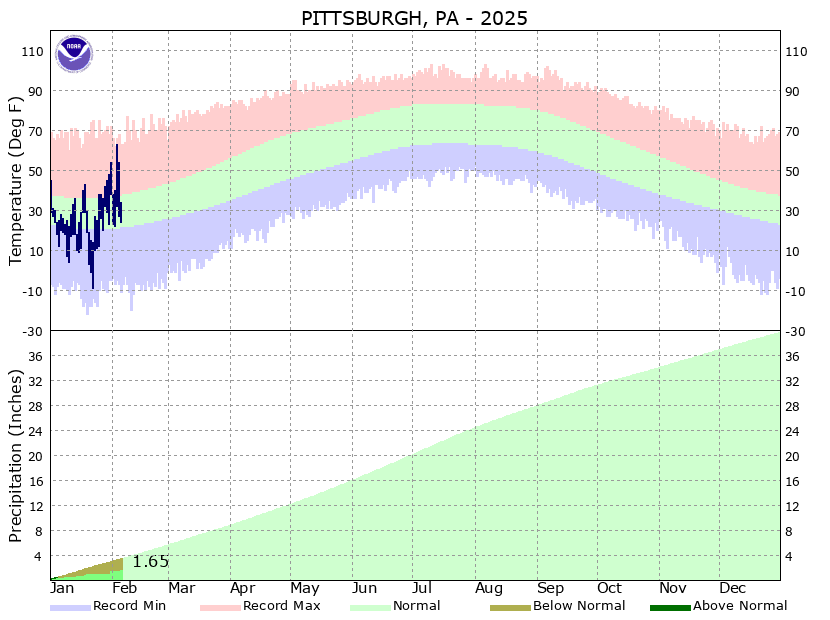
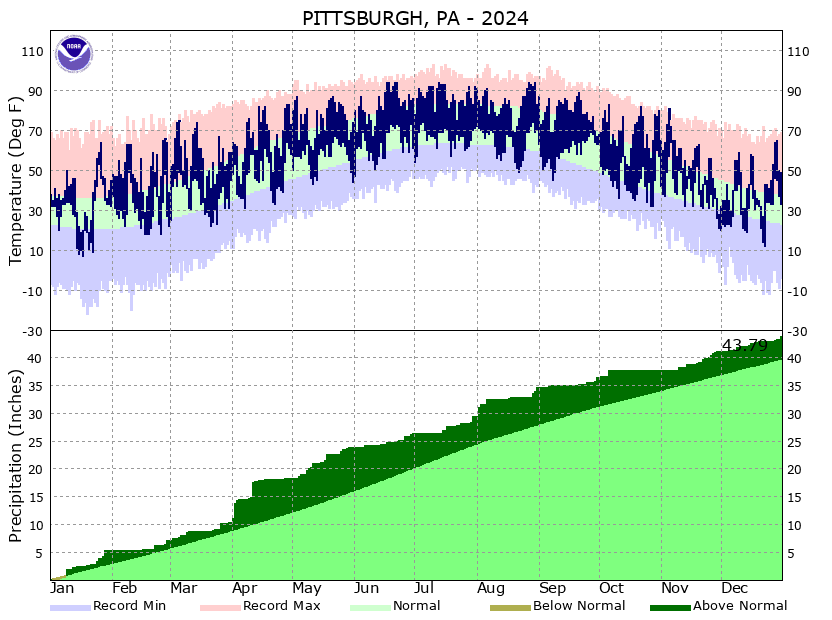
Well, it’s official that 2024 was Pittsburgh’s warmest year on record, and it is official that we just had some really chilly weeks with the polar vortex air from the Arctic. (It is also official that I probably didn’t make my Viking ancestors proud with the number of snuggly blankets I needed in the cold weather.) Even with our locally cold January, though, the world still saw its warmest global January on record!
Throughout last year and indeed even now in early 2025, articles about weather and climate seem to pop up every which way and every other day. Sometimes, though, I prefer to dig into data myself. Given that you are reading along here today, I would bet that many of you are also data buffs! With that in mind, I wanted to share a few resources to help you dig through the science yourself as well. These resources update on a regular basis to give you up-to-date information, and you can also dig through to historic data. Enjoy!
National Weather Service – Pittsburgh
The NWS Pittsburgh historic data page has a variety of different datasets we can easily access. Some of my favorite graphs to pull up are the yearly summaries of temperature and rainfall.
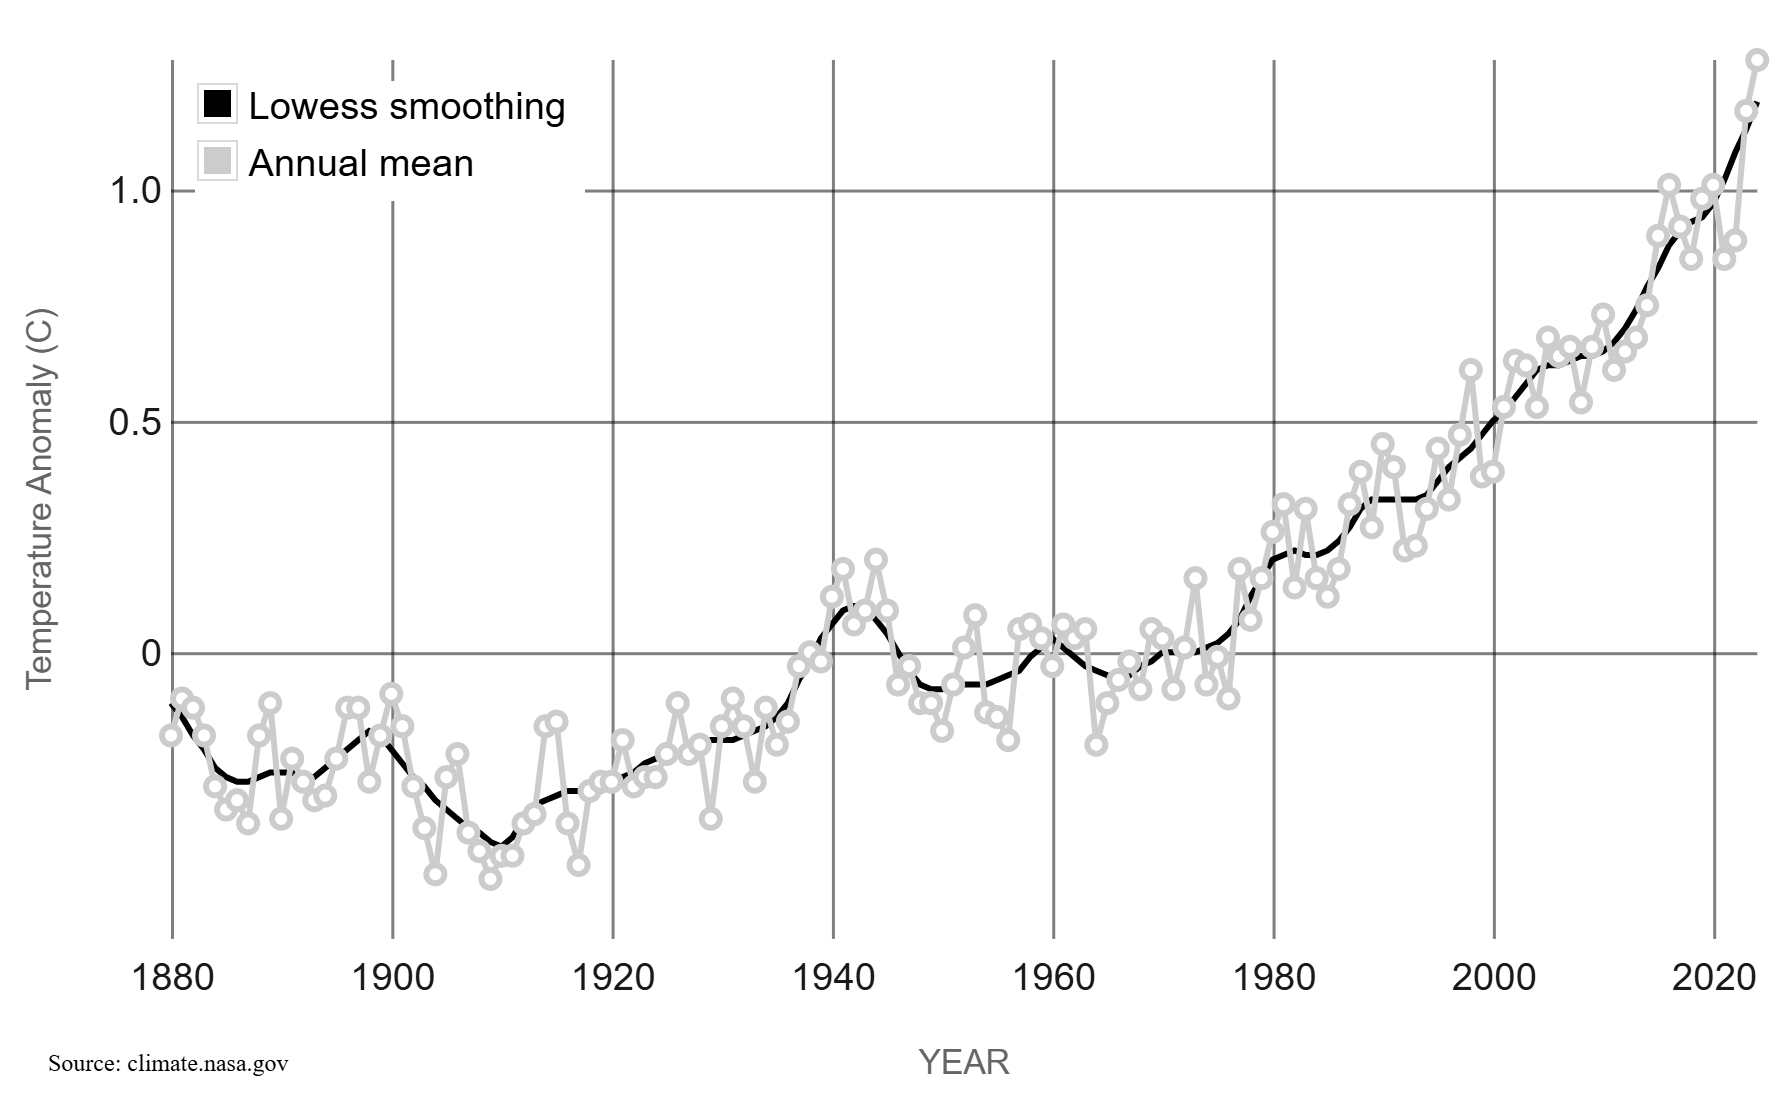
NASA Global Temperatures
On this page, you can explore temperature trends all the way back to the 1880’s when global temperature recording first became possible.
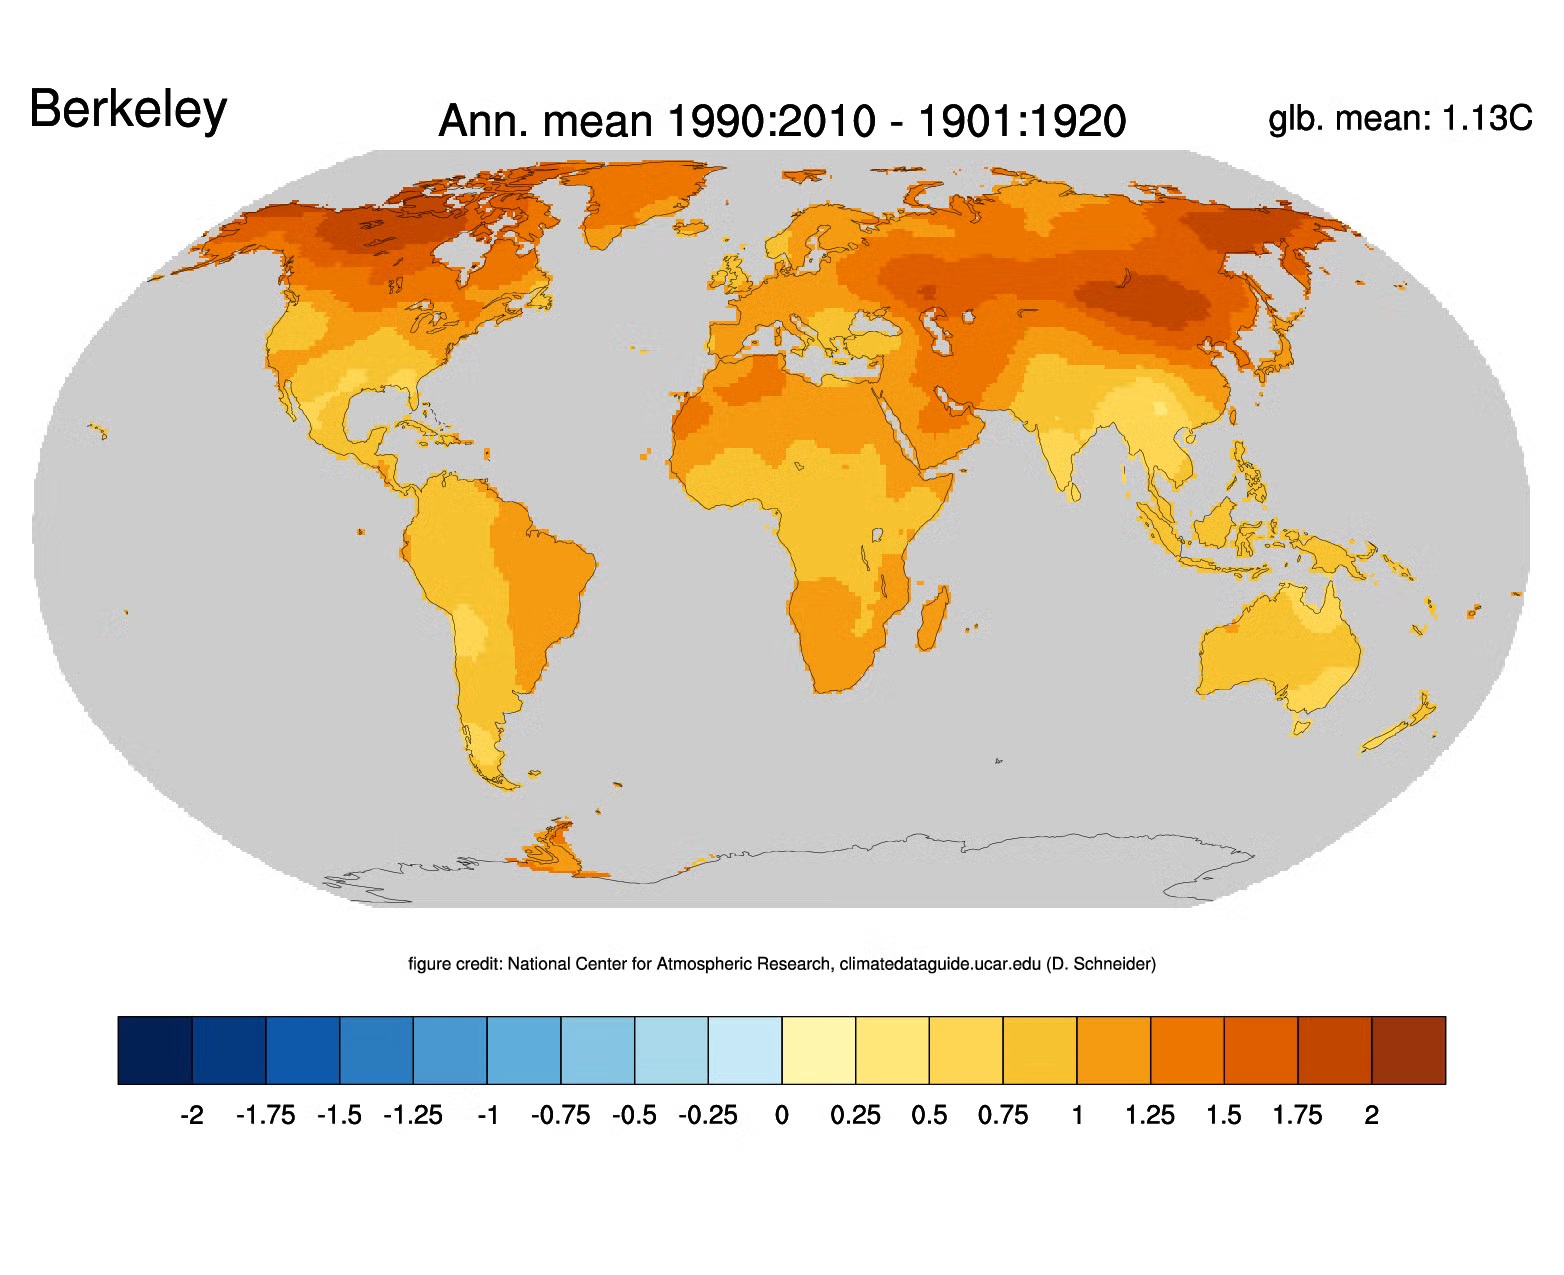
UCAR Climate Data Guide
The University Corporation for Atmospheric Research is a consortium of atmospheric science researchers from across over 100 universities. Within that consortium, NCAR, National Center for Atmospheric Research, helps maintain climate data. You can explore a variety of datasets and resources on their website!
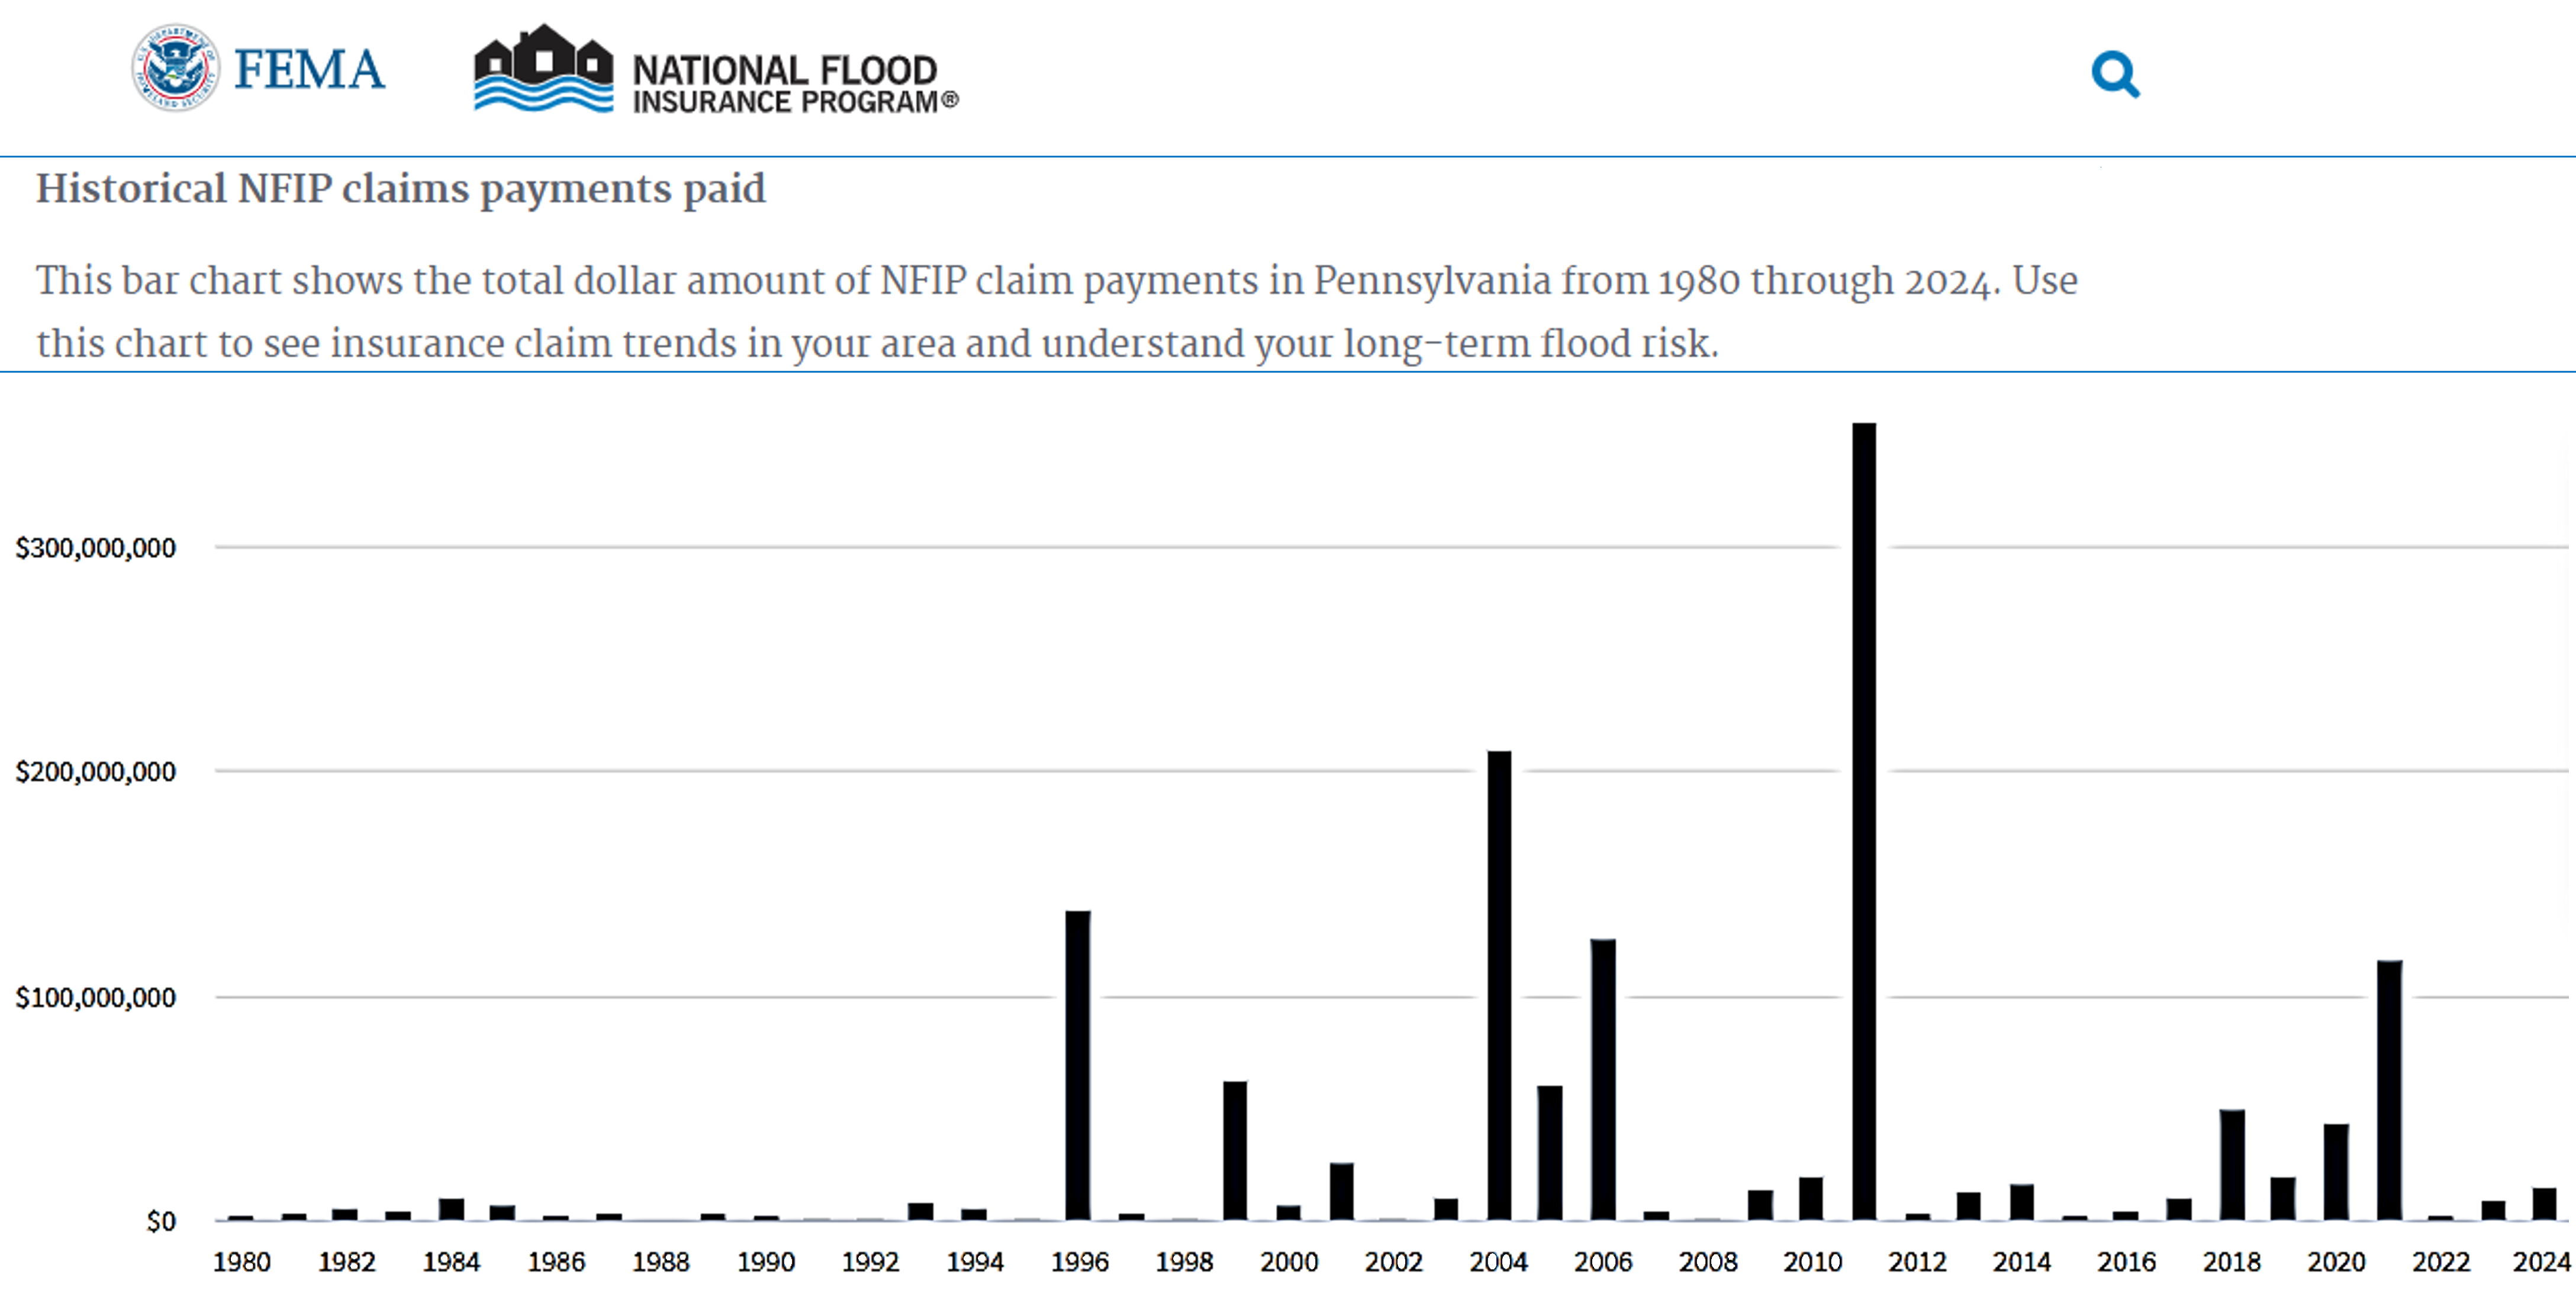
FEMA National Flood Insurance Program
This data set reflects weather events through insurance payouts. In the Pennsylvania graph below, you can see insurance claim payments for flood events have become increasingly common since 1996. The huge spike from 2011 was related to a devastating hurricane season for the east coast, including the Mid-Atlantic states.
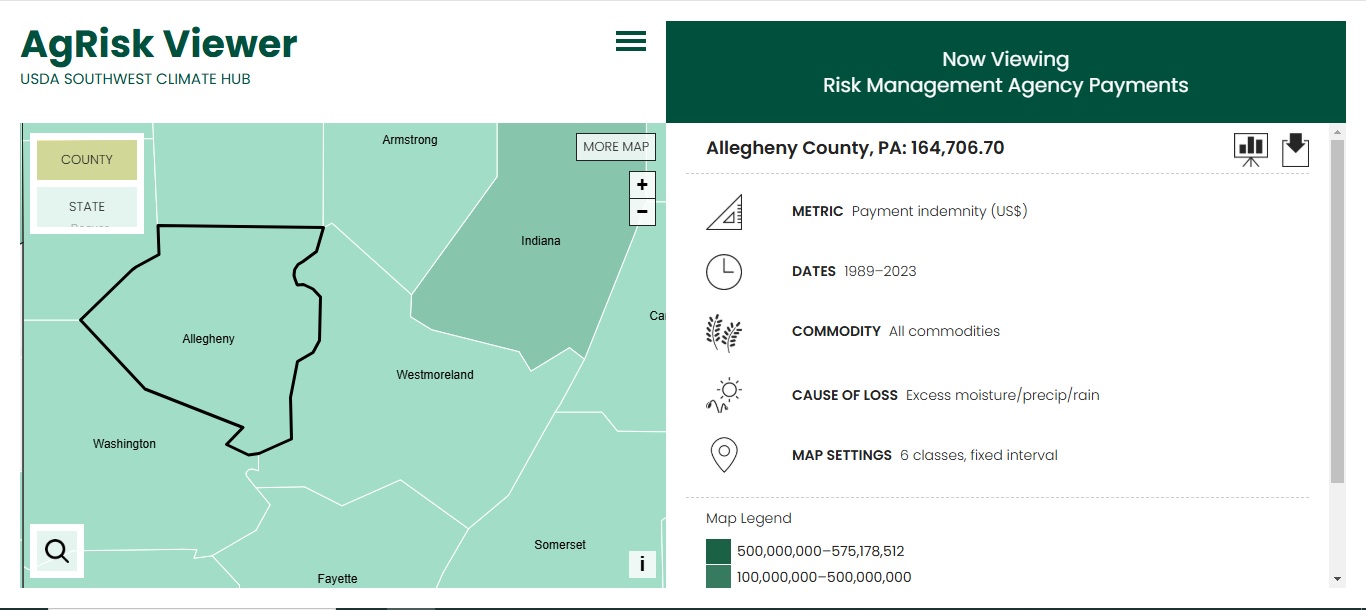
USDA Risk Management Agency - AgRisk Viewer
We can also learn quite a bit about how our climate is getting weirder by looking at the data related to agricultural insurance. We can note which years were particularly tricky for farmers based on their crop insurance payouts. You can explore the data through the viewer by state, county, crop, cause of the insurance claim and more!
Science is always worth a bit of work, so happy digging!
Photo Credits: Cover, Kreuzschnabel CC-BY-SA-3.0, and Header, Pexels CC0


